options(scipen = 999)

library(tidyverse)
library(urbnthemes)
library(lubridate)

set_urbn_defaults(style = "print")

mt <- readRDS("X:/reconstruct/mt-louisville.Rdata")

walk(paste0(here::here("functions"), "/",
            list.files(here::here("functions"))),
     source)
Home Prices
County level home prices
Total sales
mt %>%
  filter(geo_level == "County") %>%
  filter(yyyymm > 200702) %>%
  get_moving_average(grouping_var = county_name,
                 var = total_sale_med) %>%
  ggplot(aes(x = date, y = moving_average,
             group = county_name, color = county_name)) +
  geom_line() +
  scale_y_continuous(limits = c(0, 180000),
                     breaks = 0:9 * 20000,
                     expand = expand_scale(mult = c(0, 0.001)),
                     labels = scales::dollar) +
  scale_x_date(limits = c(ymd("2007-03-01"), ymd("2019-04-01")),
               expand = c(0, 0),
               date_breaks = "1 year",
               date_labels = "%Y") +
  labs(x = NULL,
       y = "Total sales: 12-month moving average")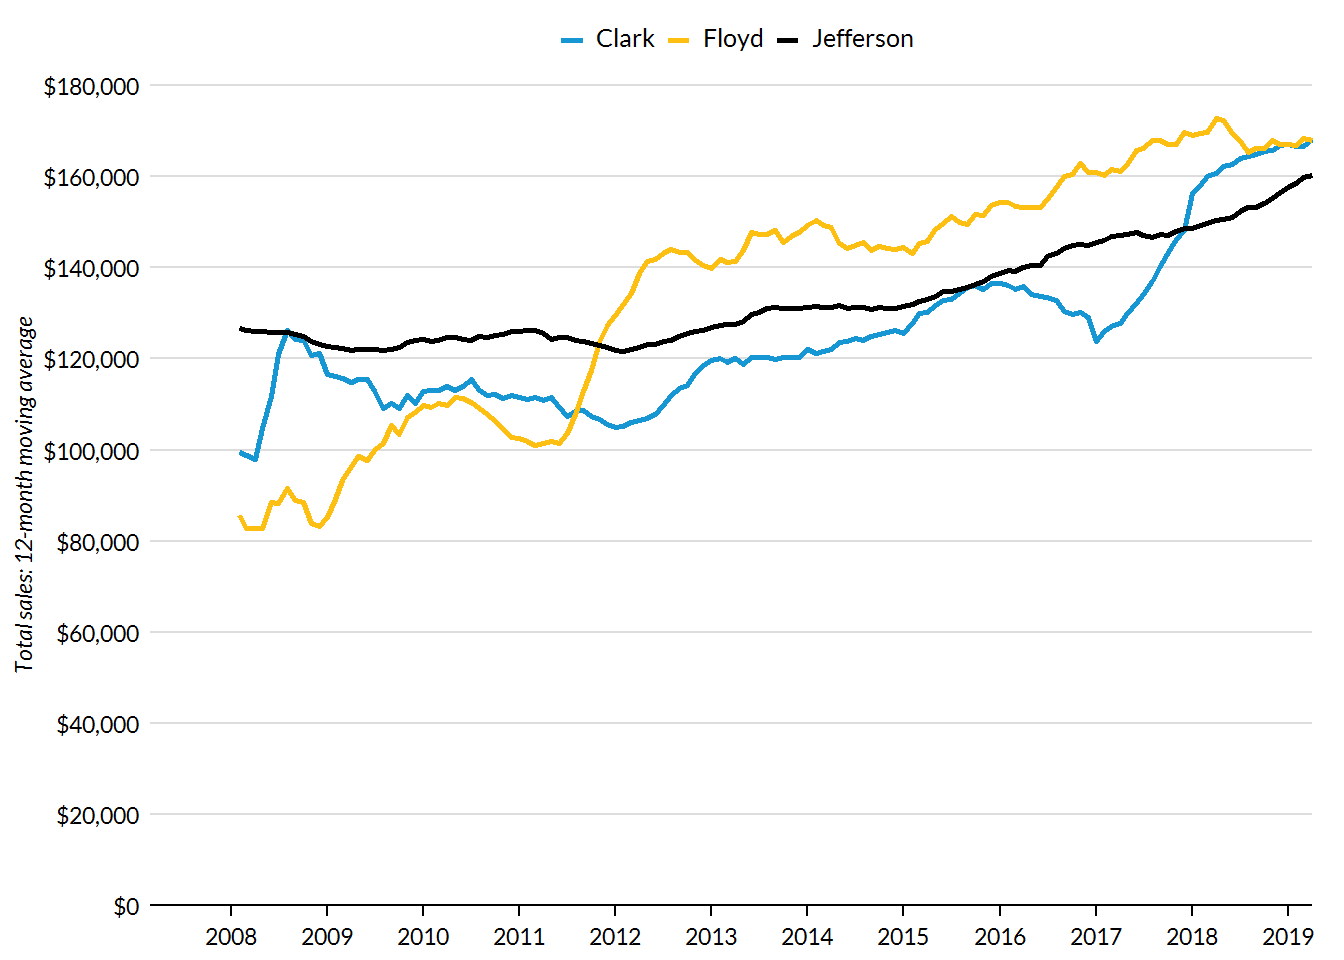
Sales by type
mt <- mt %>%
  mutate(year = str_sub(yyyymm, 1, 4))

sales_table <- mt %>%
  filter(year == "2018",
         geo_level == "County") %>%
  group_by(county_name) %>%
  summarize(Total = weighted.mean(x = total_sale_med,
                                  w = total_sale_count,
                                  na.rm = TRUE),
            Resale = weighted.mean(x = resale_sale_med,
                                   w = resale_count,
                                   na.rm = TRUE),
            `New construction` = weighted.mean(x = new_constr_med,
                                             w = new_constr_count,
                                             na.rm = TRUE),
            REO = weighted.mean(x = reo_sale_med,
                                w = reo_sale_count,
                                na.rm = TRUE)) %>%
  gather(key = "sale_type", value = "median", -county_name) %>%
  mutate(color = factor(ifelse(sale_type == "Total",
                        1,
                        0)))
Jefferson County, KY
sales_table %>%
  graph_sales_type(county = "Jefferson")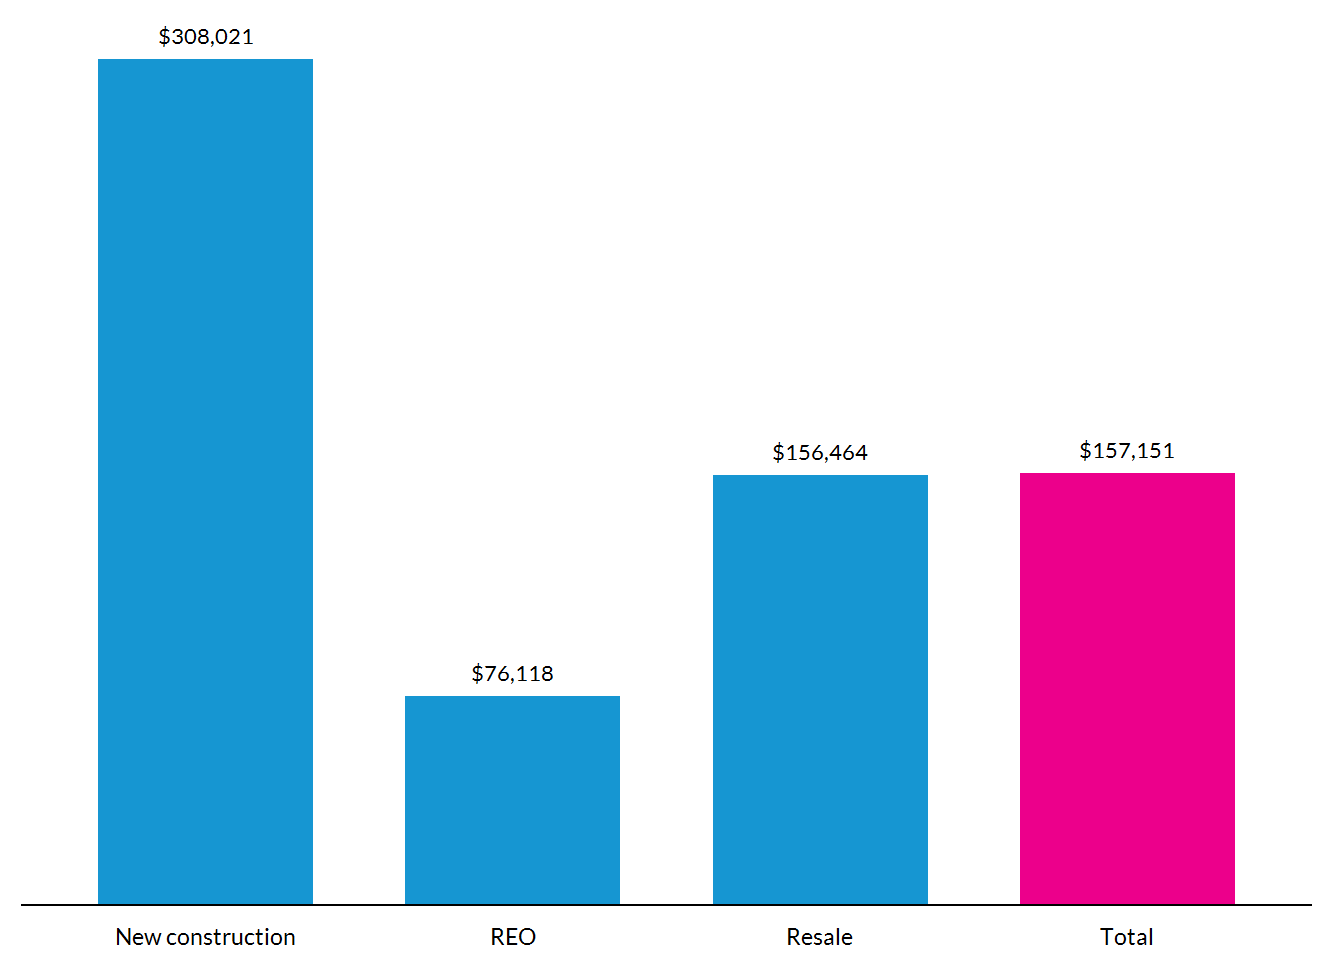
Clark County, IN
sales_table %>%
  graph_sales_type(county = "Clark")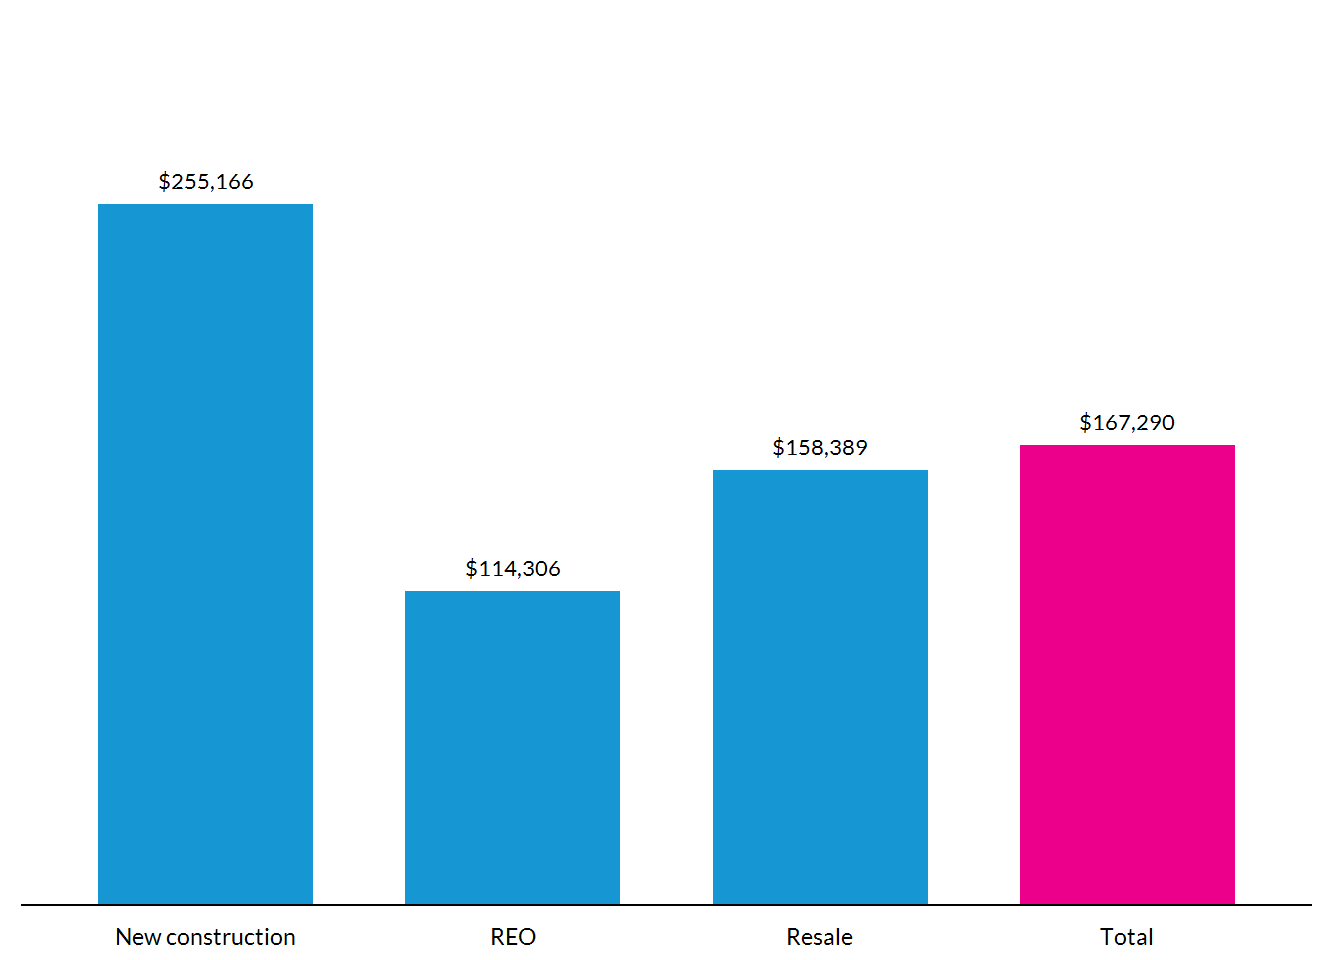
Floyd County, IN
sales_table %>%
  graph_sales_type(county = "Floyd")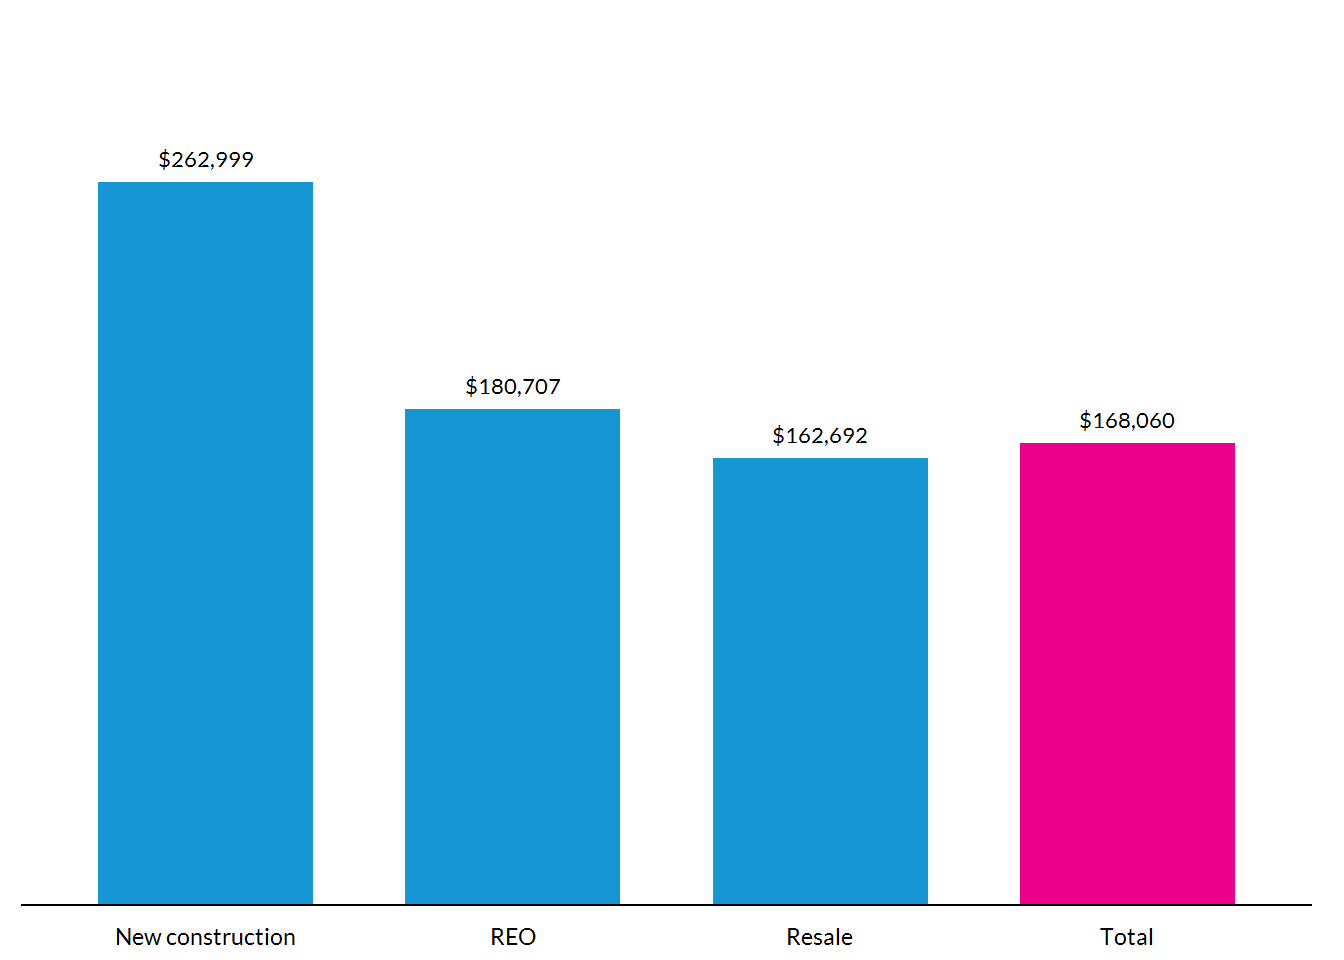
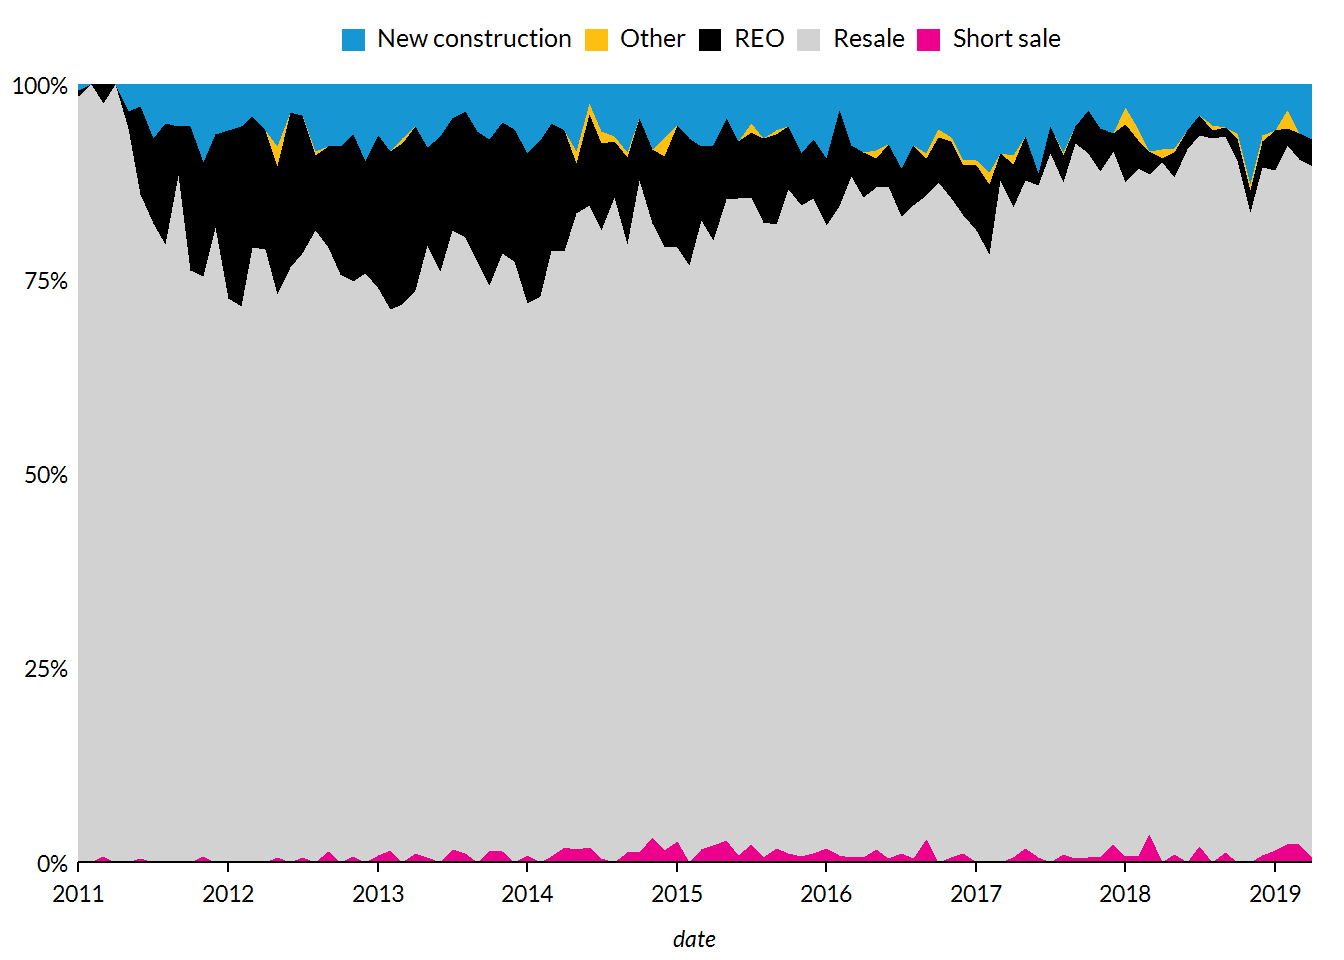
Home Sales Composition
All counties
mt %>%
  filter(geo_level == "County") %>%
  group_by(date) %>%
  summarize(`New construction` = sum(new_constr_count, na.rm = TRUE),
            Resale = sum(resale_count, na.rm = TRUE),
            REO = sum(reo_sale_count, na.rm = TRUE),
            `Short sale` = sum(short_sale_count, na.rm = TRUE),
            Other = sum(other_sale_count, na.rm = TRUE)) %>%
  gather(key = "sale_type", value = "count", -date) %>%
  graph_sales_composition(county = "All")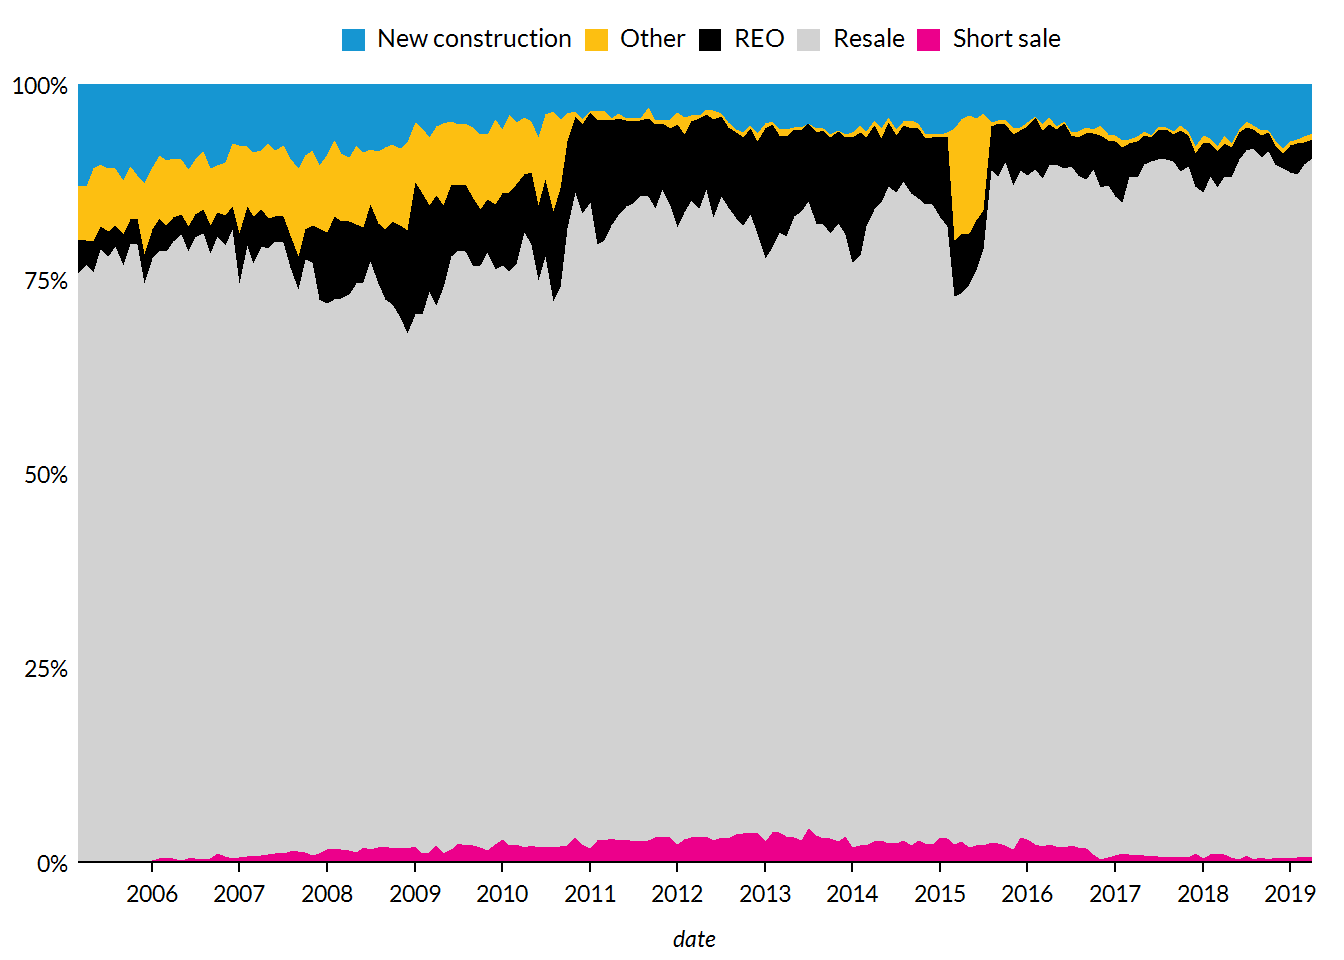
comp_table <- mt %>%
  filter(geo_level == "County") %>%
  group_by(date, county_name) %>%
  summarize(`New construction` = sum(new_constr_count, na.rm = TRUE),
            Resale = sum(resale_count, na.rm = TRUE),
            REO = sum(reo_sale_count, na.rm = TRUE),
            `Short sale` = sum(short_sale_count, na.rm = TRUE),
            Other = sum(other_sale_count, na.rm = TRUE),
            Total = sum(total_sale_count, na.rm = TRUE)) %>%
  gather(key = "sale_type", value = "count", -date, -county_name)
By county
Jefferson County, KY
comp_table %>%
  graph_sales_composition(county = "Jefferson")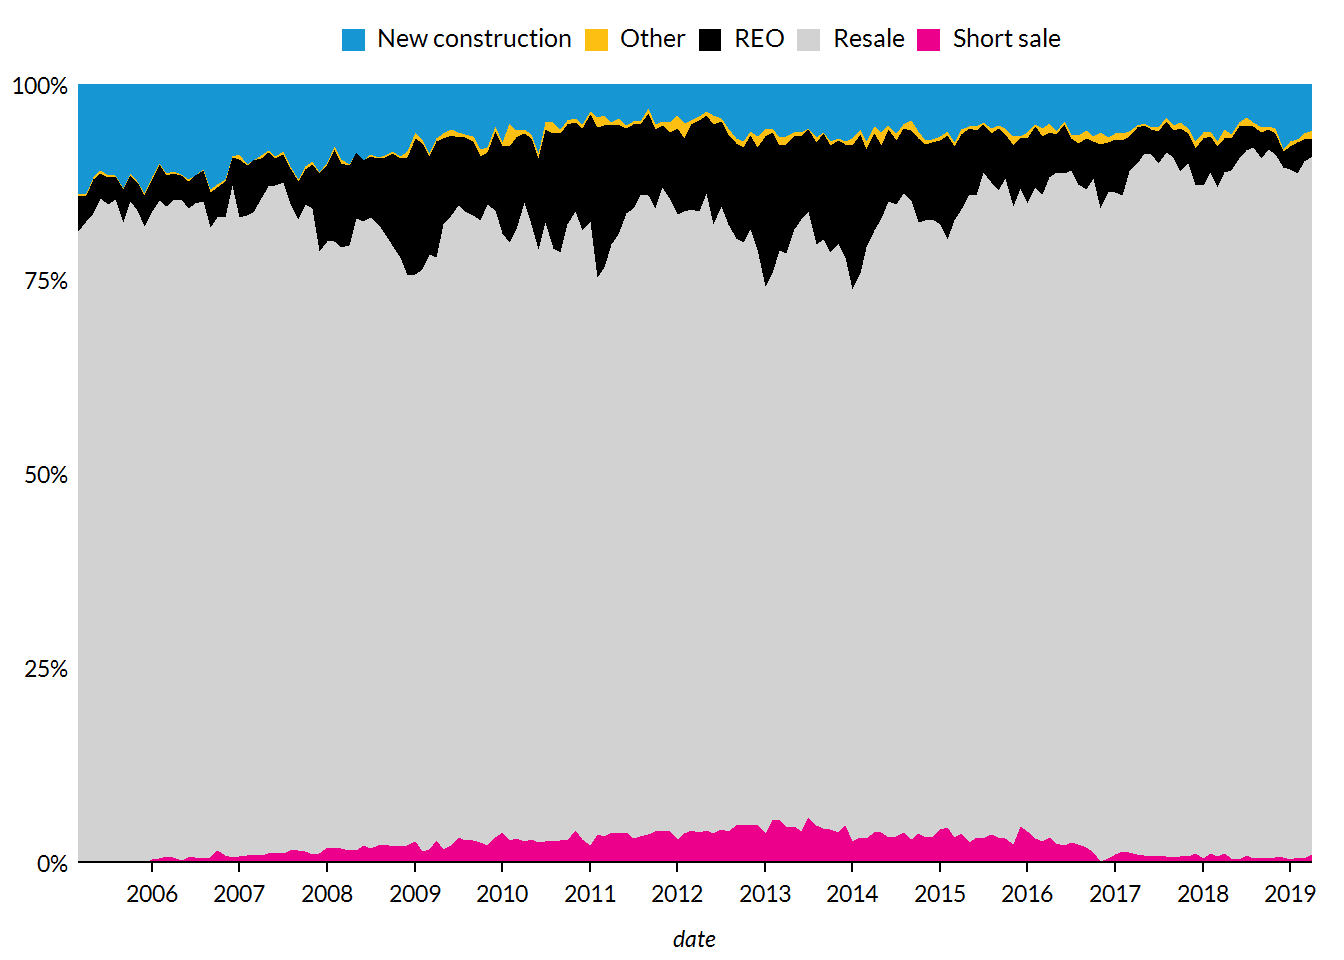
Clark County, IN
comp_table %>%
  graph_sales_composition(county = "Clark",
                          start_date = "2009-01-01")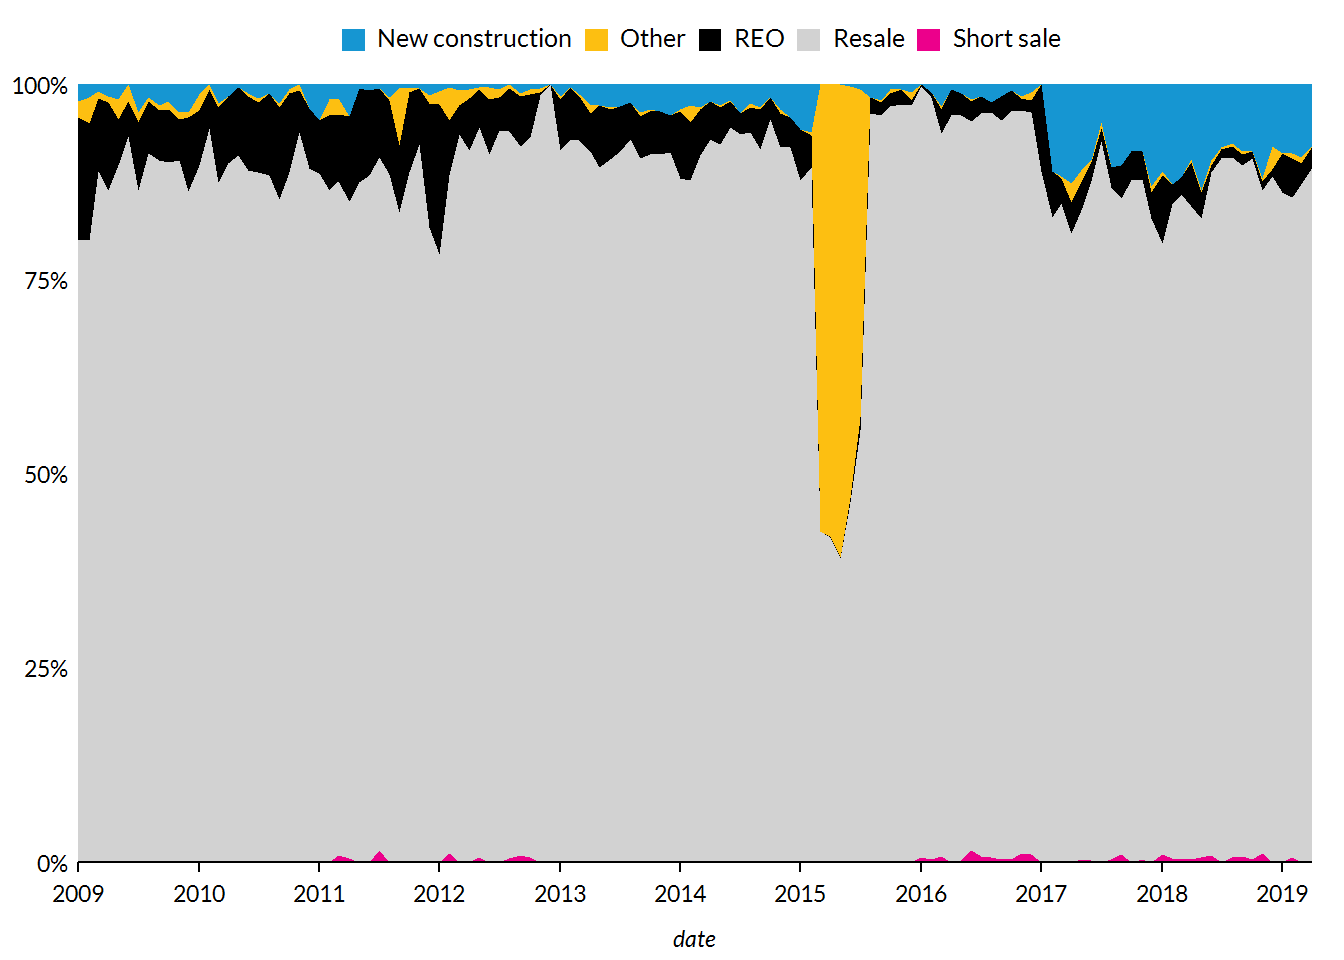
Floyd County, IN
comp_table %>%
  graph_sales_composition(county = "Floyd",
                          start_date = "2011-01-01")