Lending Landscape
Top Lenders
Small loans (< $90,000)
| Lender | Loans | Average loan amount | Median borrower income | Median DTI | Median LTV | Share of loans to black borrowers |
|---|---|---|---|---|---|---|
| PNC BANK NA | 307 | $46,336 | $58,000 | 33 | 59 | 11.4% |
| Republic Bank & Trust Company | 273 | $46,429 | $53,000 | 33 | 90 | 12.8% |
| Commonwealth Bank and Trust Company | 271 | $25,406 | $50,000 | 33 | 80 | 18.1% |
| Park Community Credit Union | 171 | $49,503 | $70,000 | 25 | 74 | 7.6% |
| River City Bank | 168 | $48,810 | $74,500 | NA | NA | 4.2% |
| US BANK, N.A. | 145 | $48,172 | $54,000 | 25 | 74 | 7.6% |
| Century Mortgage Company DBA Century Lending Company | 117 | $66,709 | $3,000 | 33 | 80 | 2.6% |
| Quicken Loans | 115 | $64,391 | $36,000 | 33 | 74 | 8.7% |
| Stockton Mortgage Corporation | 99 | $27,222 | $39,000 | 37 | 101 | 52.5% |
| FAIRWAY INDEPENDENT MORT CORP | 97 | $29,845 | $44,000 | 39 | 100 | 18.6% |
All loans
| Lender | Loans | Average loan amount | Median borrower income | Median DTI | Median LTV | Share of loans to black borrowers |
|---|---|---|---|---|---|---|
| Century Mortgage Company DBA Century Lending Company | 1688 | $174,775 | $5,000 | 37 | 95 | 1.5% |
| Commonwealth Bank and Trust Company | 1258 | $164,356 | $63,000 | 36 | 90 | 9.9% |
| Republic Bank & Trust Company | 1180 | $168,042 | $65,000 | 33 | 100 | 9.5% |
| Quicken Loans | 984 | $158,404 | $63,000 | 36 | 80 | 7.1% |
| United Shore Financial Services LLC | 950 | $204,884 | $65,000 | 37 | 90 | 4.7% |
| PNC BANK NA | 776 | $137,139 | $70,000 | 33 | 74 | 7.5% |
| US BANK, N.A. | 628 | $134,459 | $45,000 | 36 | 90 | 4.0% |
| JPMorgan Chase Bank, NA | 596 | $214,732 | $77,000 | 33 | 80 | 5.5% |
| Platinum Mortgage Inc | 521 | $175,038 | $63,000 | 37 | 89 | 4.2% |
| Fifth Third Mortgage Company | 513 | $175,936 | $64,000 | 33 | 80 | 5.8% |
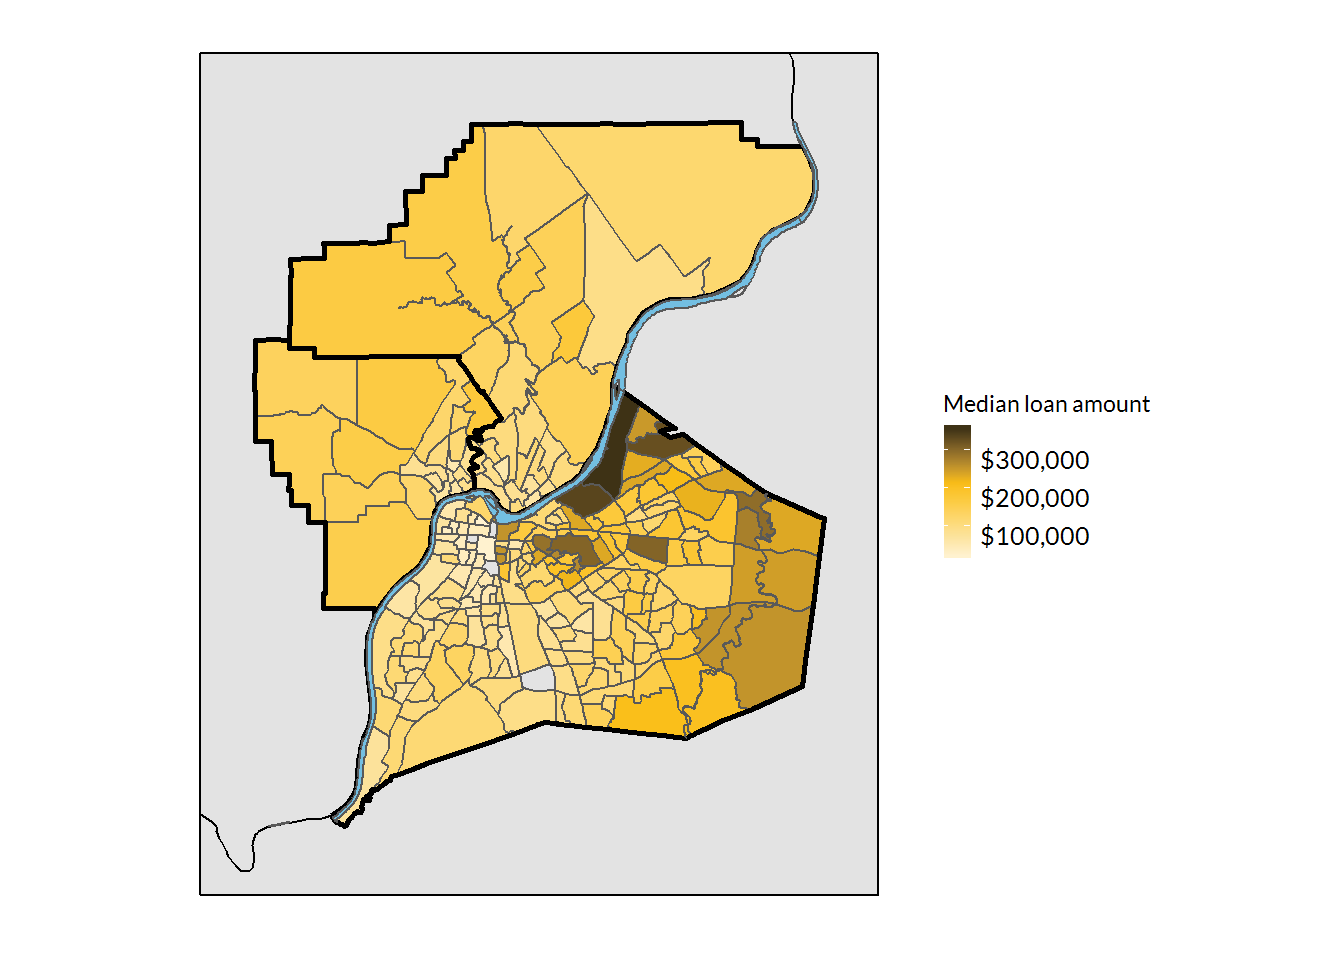
Lending by Neighborhood
Loan Amount by Neighborhood
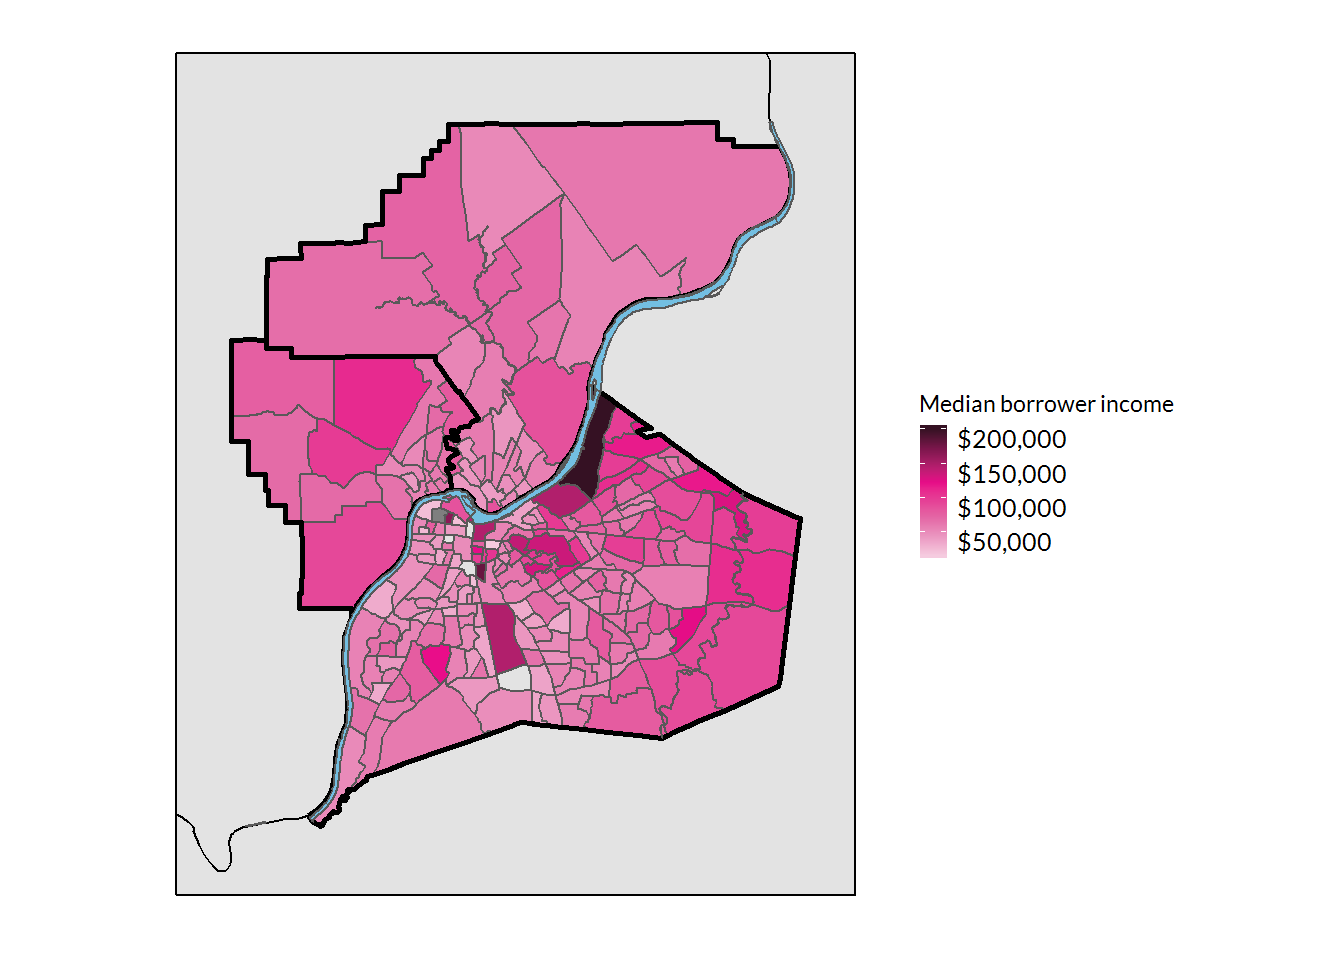
Borrower Income by Neighborhood
Credit Characteristics
Credit by loan amount
All loans
| Loan amount | Loans | Conventional share | Median DTI | Median LTV | Median income |
|---|---|---|---|---|---|
| <= $80,000 | 3,182 | 89.4% | 33 | 80.0 | $44,000 |
| $80,000 - $150,000 | 7,834 | 70.0% | 36 | 89.7 | $46,000 |
| $150,000 - $300,000 | 8,392 | 70.6% | 37 | 90.0 | $73,000 |
| > $300,000 | 2,253 | 87.7% | 33 | 80.0 | $147,000 |
Purchase loans
| Loan amount | Loans | Conventional share | Median DTI | Median LTV | Median income |
|---|---|---|---|---|---|
| <= $80,000 | 1,975 | 88.6% | 33 | 94.62 | $42,000 |
| $80,000 - $150,000 | 5,467 | 67.8% | 36 | 96.50 | $42,000 |
| $150,000 - $300,000 | 6,533 | 69.5% | 37 | 95.00 | $70,000 |
| > $300,000 | 1,768 | 87.7% | 33 | 85.00 | $146,000 |
Refi loans
| Loan amount | Loans | Conventional share | Median DTI | Median LTV | Median income |
|---|---|---|---|---|---|
| <= $80,000 | 1,207 | 90.7% | 33 | 60.484 | $47,000 |
| $80,000 - $150,000 | 2,367 | 75.0% | 33 | 75.000 | $55,000 |
| $150,000 - $300,000 | 1,859 | 74.7% | 36 | 78.130 | $84,000 |
| > $300,000 | 485 | 88.0% | 36 | 77.965 | $150,000 |
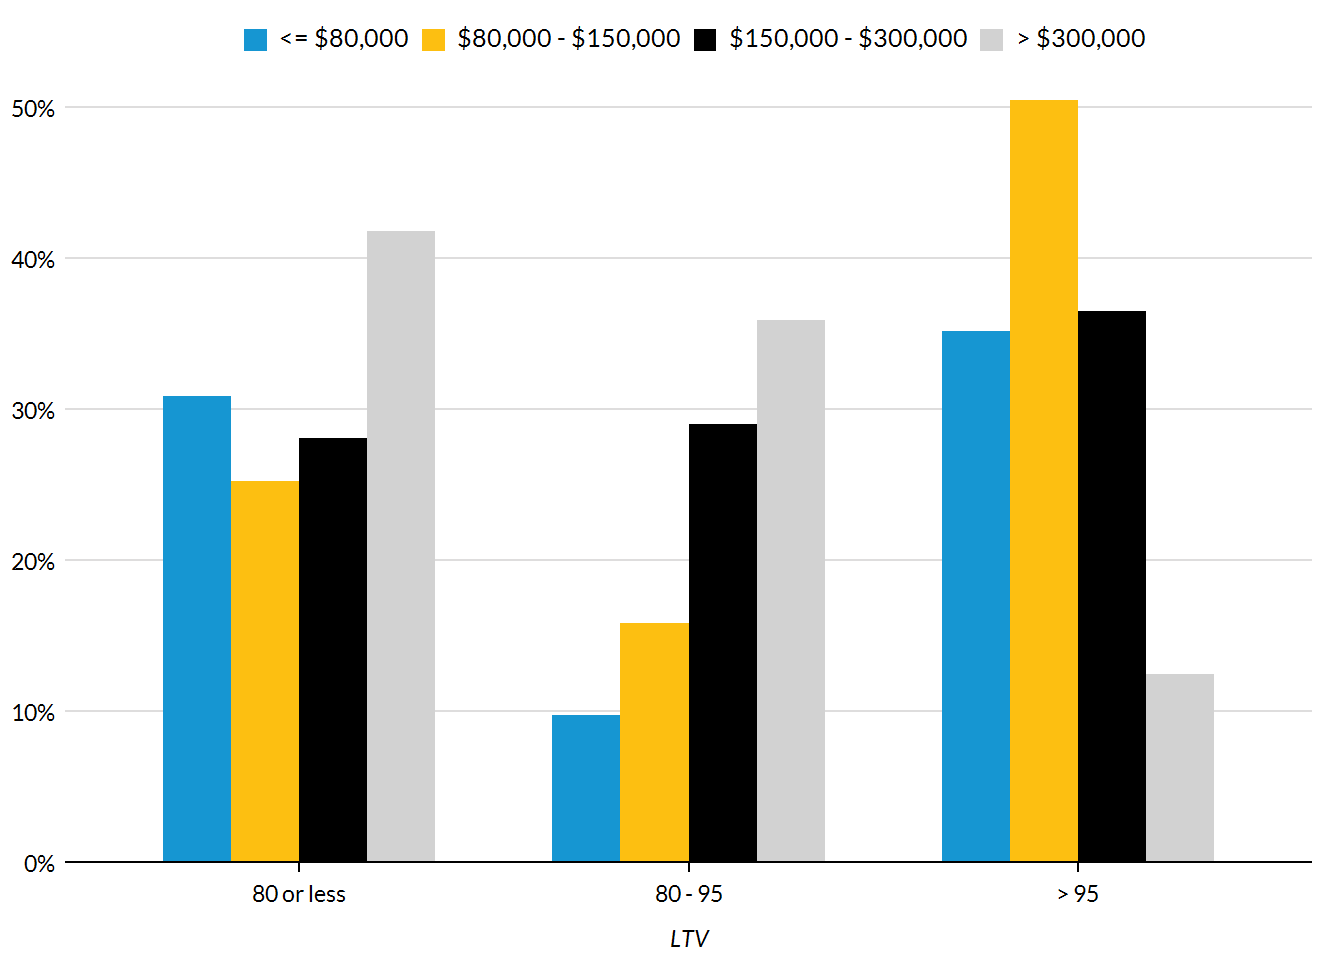
LTV
Purchase loans only
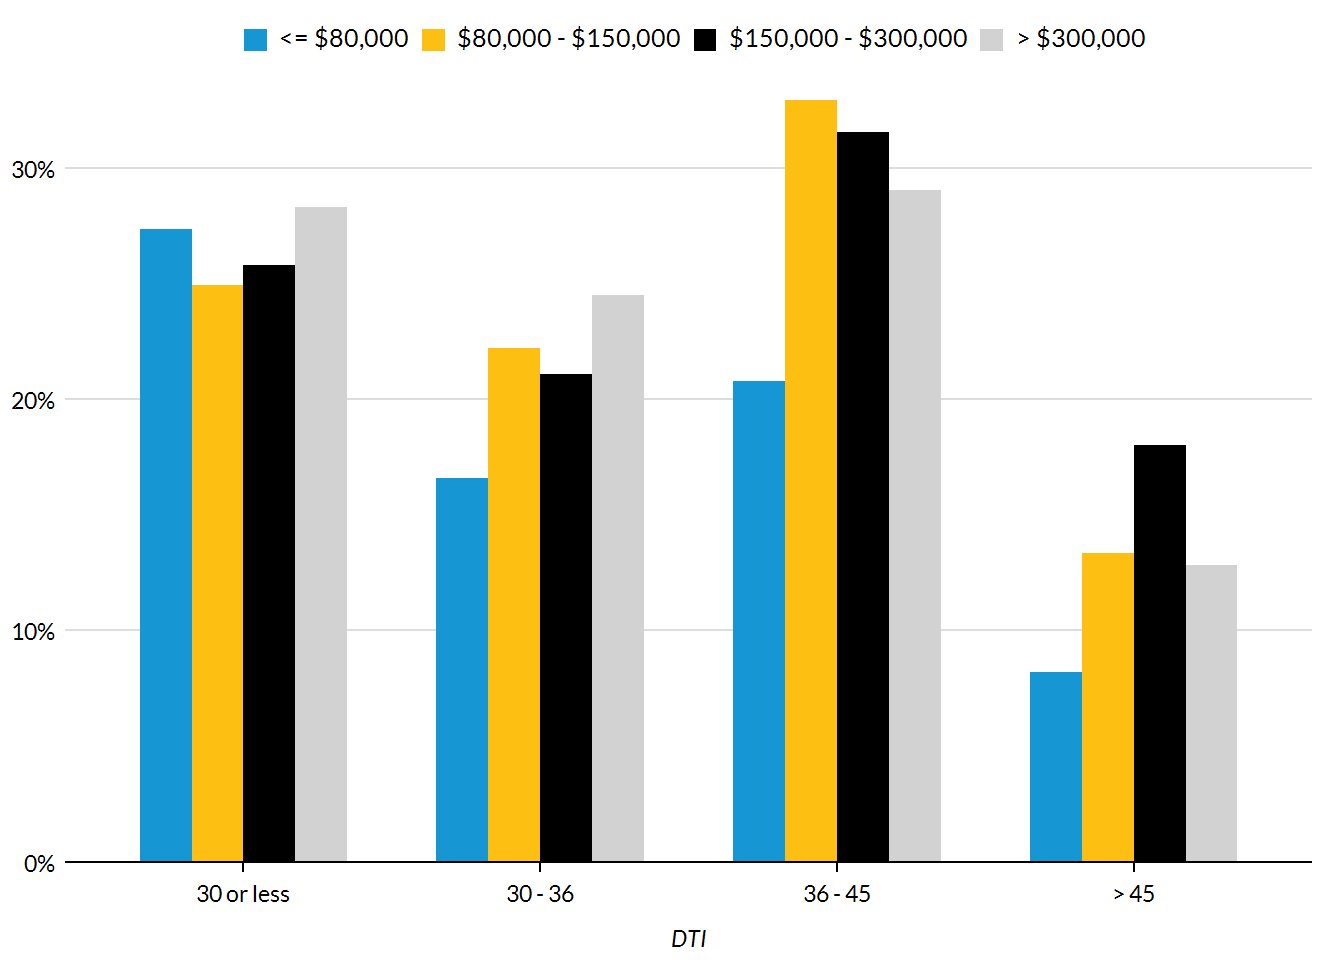
DTI
Loan characteristics
Loan costs
Conventional loans
| Loan amount | Loans | Interest rate | Rate spread | Total loan costs | Origination charges |
|---|---|---|---|---|---|
| <= $80,000 | 2844 | 5.17 | 0.79 | 1622.51 | 695.85 |
| $80,000 - $150,000 | 5483 | 4.93 | 0.71 | 2467.54 | 1118.25 |
| $150,000 - $300,000 | 5927 | 4.75 | 0.50 | 2777.63 | 1221.89 |
| > $300,000 | 1977 | 4.59 | 0.33 | 3566.06 | 1398.48 |
FHA loans
| Loan amount | Loans | Interest rate | Rate spread | Total loan costs | Origination charges |
|---|---|---|---|---|---|
| <= $80,000 | 290 | 4.92 | 1.60 | 3509.74 | 1106.25 |
| $80,000 - $150,000 | 1854 | 4.81 | 1.38 | 4517.22 | 1164.87 |
| $150,000 - $300,000 | 1579 | 4.72 | 1.23 | 6043.74 | 1156.96 |
| > $300,000 | 58 | 4.66 | 1.11 | 8606.14 | 1372.79 |
VA loans
| Loan amount | Loans | Interest rate | Rate spread | Total loan costs | Origination charges |
|---|---|---|---|---|---|
| <= $80,000 | 43 | 4.64 | 0.71 | 2552.56 | 877.55 |
| $80,000 - $150,000 | 401 | 4.70 | 0.48 | 3852.84 | 1228.39 |
| $150,000 - $300,000 | 805 | 4.60 | 0.29 | 5381.55 | 1245.22 |
| > $300,000 | 217 | 4.44 | 0.09 | 7738.10 | 1331.93 |
Loan features
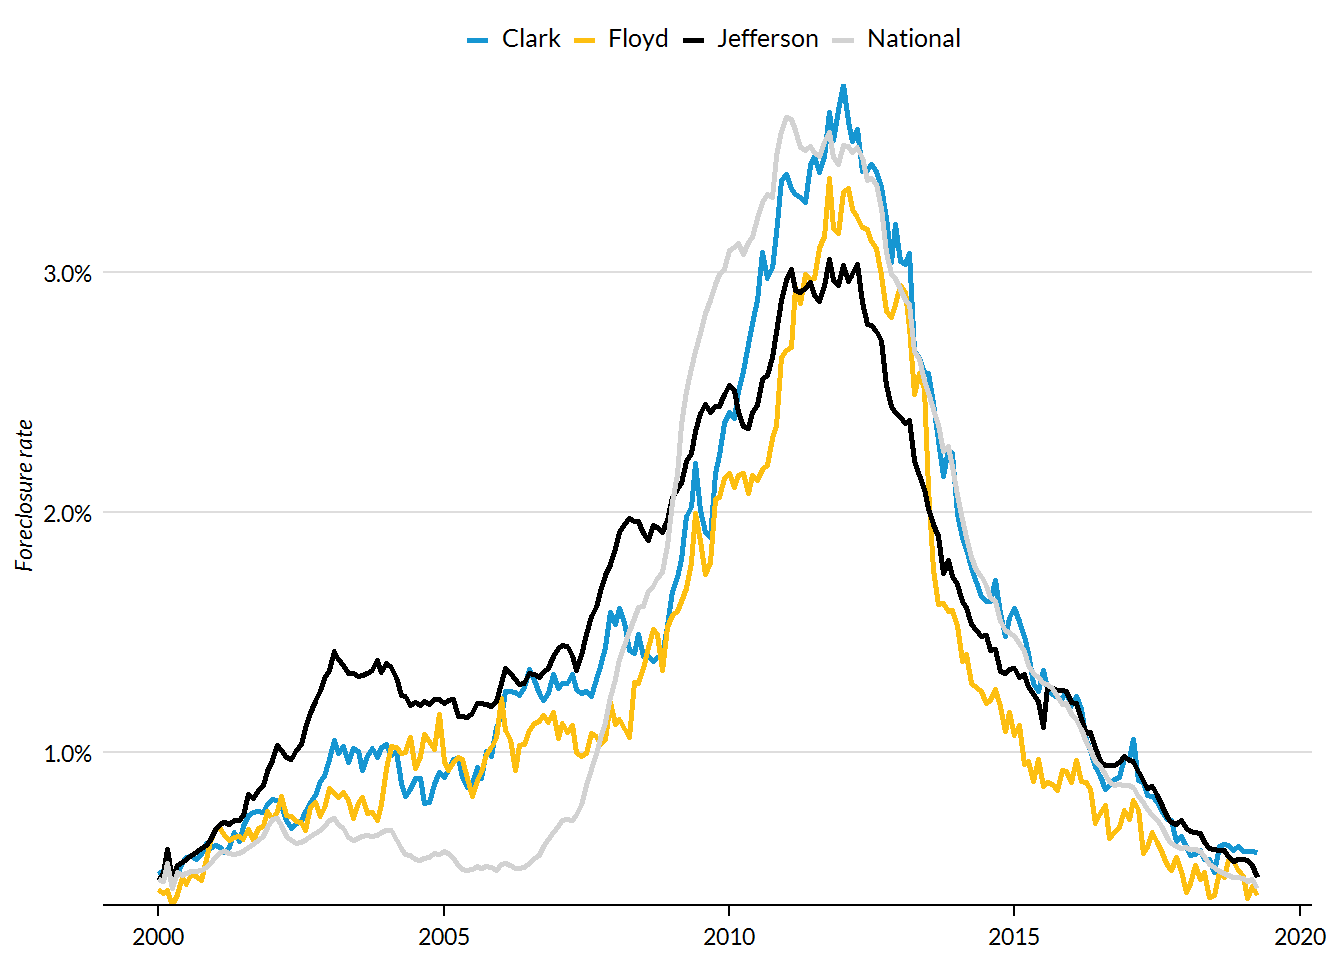
Loan Performance
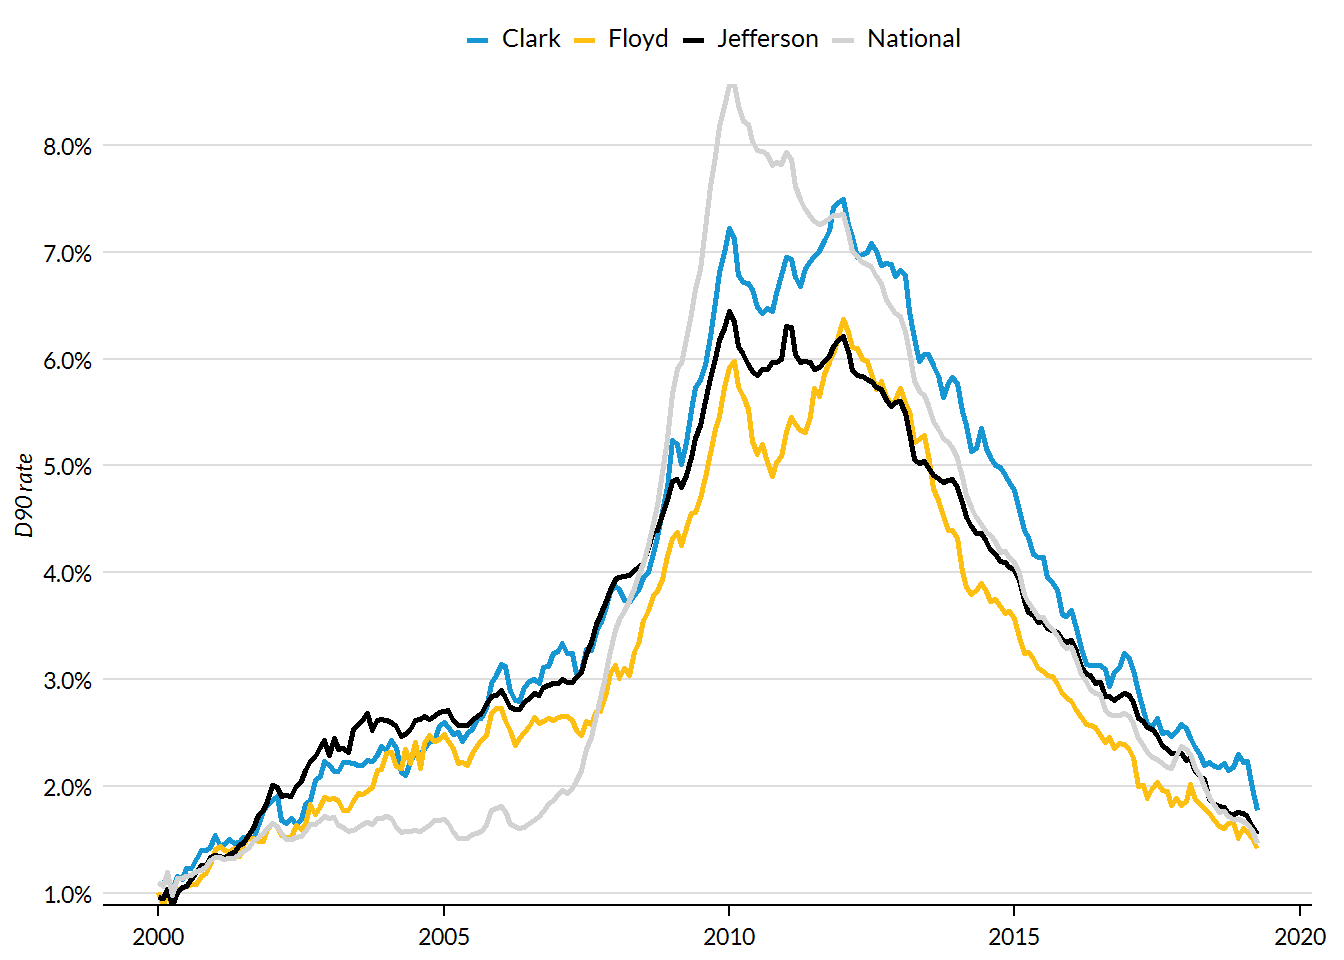
Delinquency rate by county
Foreclosure rate by county