#
# This is a Shiny web application. You can run the application by clicking
# the "Run App" button above.
#
# Find out more about building applications with Shiny here:
#
#    http://shiny.rstudio.com/
#
#load libraries
library(shiny)
library(tidyverse)
library(urbnthemes)
#set urban theme branding
set_urbn_defaults()

# set shiny options
options(shiny.sanitize.errors = TRUE)
options(scipen = 999)


# create user interface
ui <- fluidPage(

  # make sure shiny.css is in www/
  # if not, delete the following line
  theme = "shiny.css",
  #add input to select quantitative variable
  selectInput("quantitative",
              label = h3("Select Quantitative Variable"),
              choices = c("Height" = "height", "Mass" = "mass"),
              selected = "height"),
  #add input to select categorical variable
  selectInput("categorical",
              label = h3("Select Categorical Variable"),
              choices = c("Name" = "name",
                          "Skin Color" = "skin_color",
                          "Hair Color" = "hair_color",
                          "Homeworld" = "homeworld")),
  #create plot
  plotOutput("my_plot")


)

# create server session
server <- function(input, output) {

#create output plot
output$my_plot <- renderPlot({
  starwars %>%
    slice(1:10) %>%
    select(cat = contains(input$categorical),
           quant = contains(input$quantitative)) %>%
    ggplot() +
    geom_col(mapping = aes(x = cat, y = quant))


})

}

# build shiny application
shinyApp(ui = ui, server = server)R Shiny Apps
What is R Shiny?
R Shiny is an R package that enables the creation of interactive, web-based applications. These apps can be extended with CSS, Javascript and htmlwidgets to add extra pizazz.
What is a typical use case at Urban?
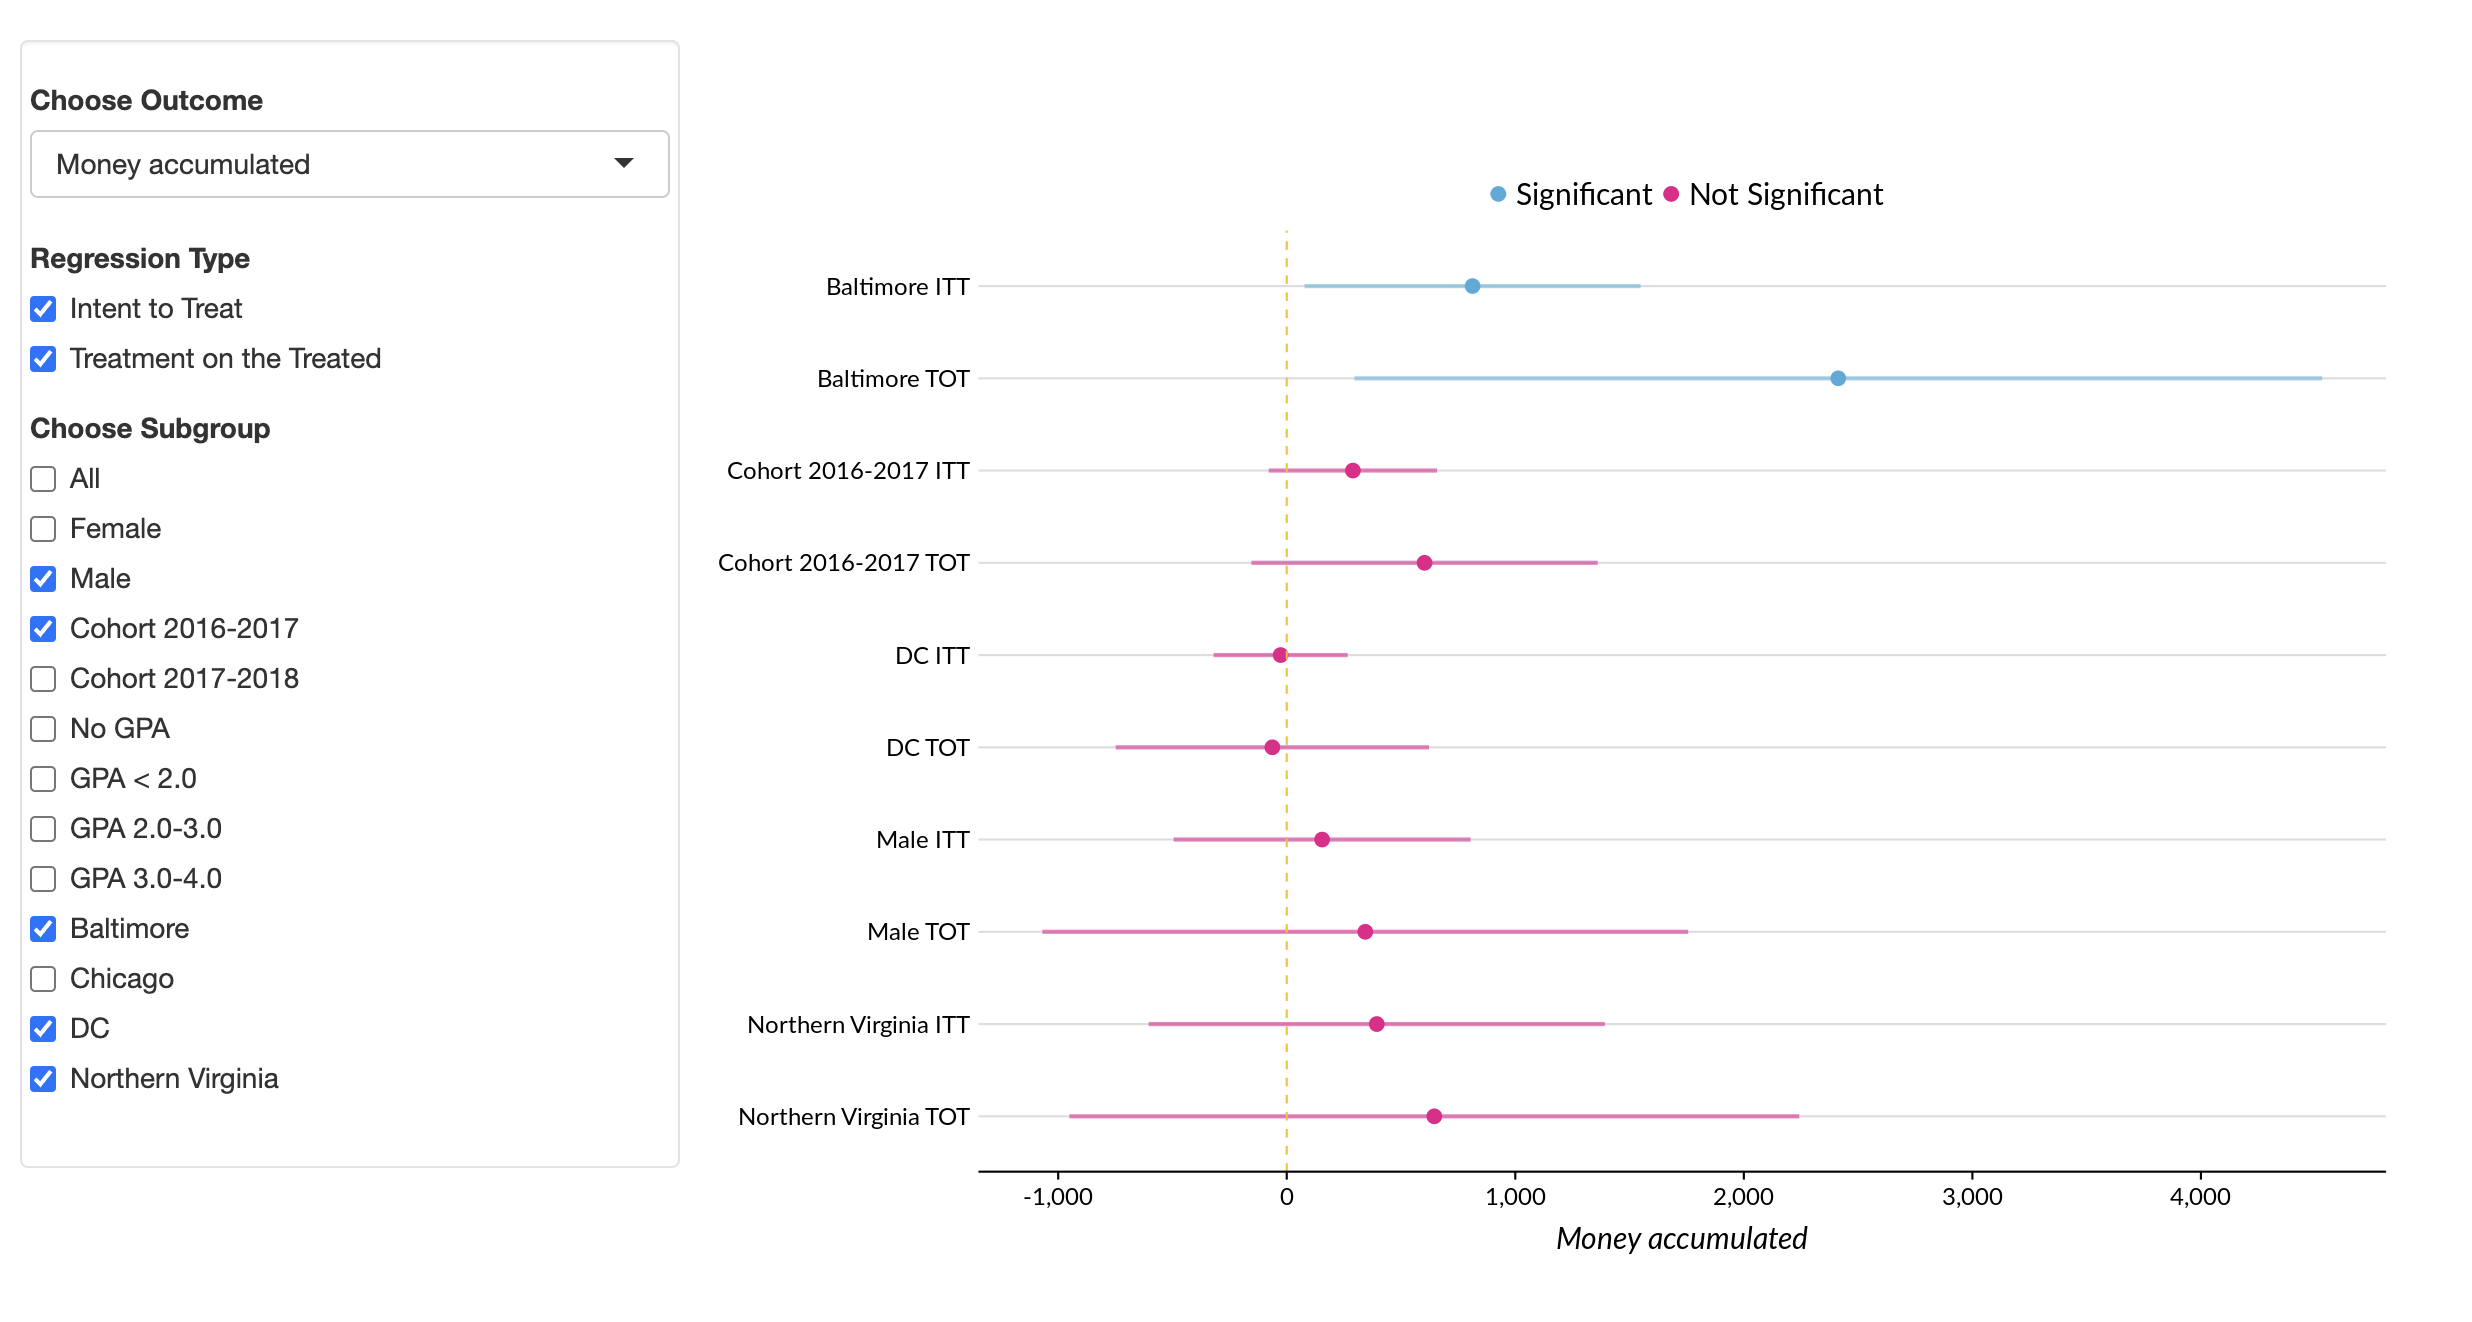
Shiny apps are most often used internally (or sometimes given to partners for private use) to examine data or results with many variables or models. They are great when visual aids would be easier to digest than long tables. For example, if you have a regression model that spits out hundreds of coefficients, or frequency tables for multiple different subsets of data, rather than have dozens of static images to scroll through, shiny lets you visualize them interactively and therefore engage with the results much more easily and intuitively. Below is an example of a shiny app that was developed and shared with a partner that let them select the outcome, regression type, and subgroup and display it all on one plot. Wow!

When to NOT Use a Shiny App
- A public-facing tool is needed
- You have no reason to examine multiple results
- The project is short and/or does not have enough budget
- The results are easily digestible in another format (such as R Quarto)
Getting Started
One quick way to get started using shiny is to use a helpful package made by colleagues at Urban: the urbntemplates package. This package allows you to automatically generate specific files that you commonly use.
To do this for shiny apps, you can use the urbntemplates::construct_shiny() function. This will create:
- app.R (do not change the name of this document)
- shiny_instructions.md
- .gitignore
- www/shiny.css (styles for web)
Inside app.R
To create shiny apps, we generally include code in an app.R file. Each app.R file should contain:
- A user interface
uiobject that describes how the web page will look - A
serverobject, which handles the inputs put in by the user and renders output - A
shinyApp()function to run the app using the above two objects
User Interface
The user interface portion of the app lays out what the user sees when visiting the webpage. If familiar with HTML, it is similar in that it creates the structure for the webpage.
ui objects often start with a fluidPage() function, which generates a page that automatically adjusts to the dimensions of the browser window. You place elements in the this function to add content to the page.
Input and Output functions
In the user interface portion of the app, we can utilize two types of functions: input functions and output functions.
Input Functions
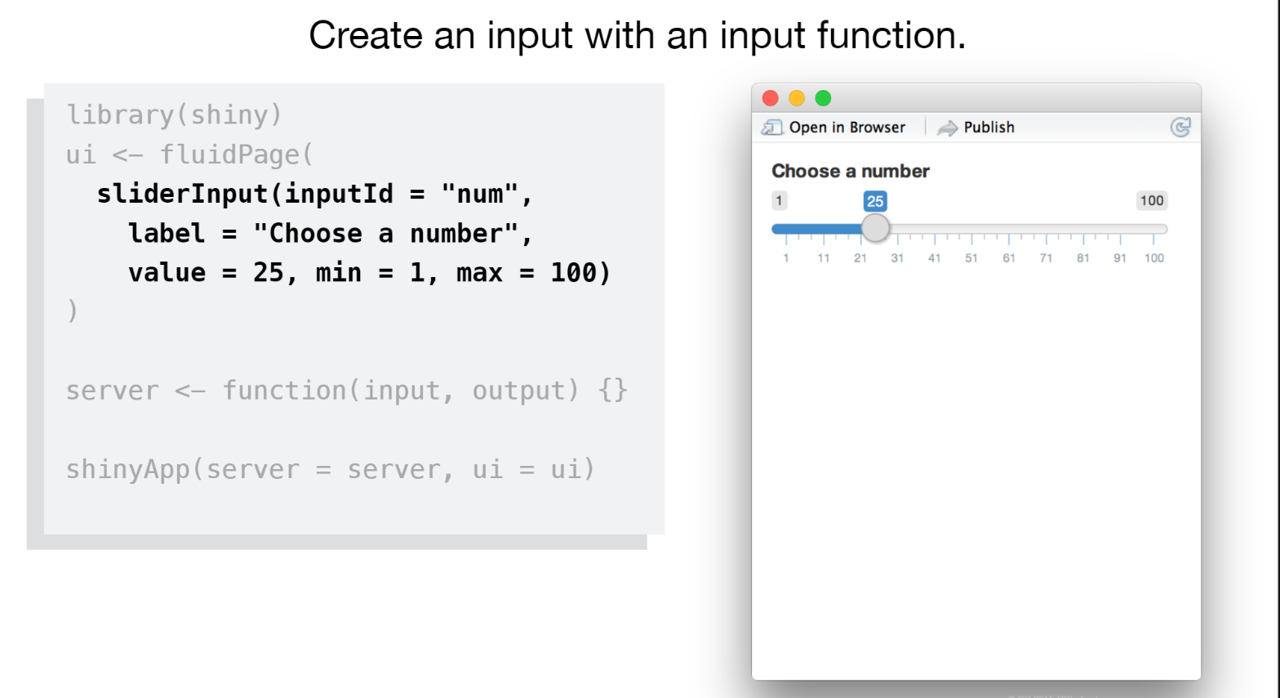
These functions take in information from the user.

For a list of shiny input widgets, you can look at the Shiny Widget Gallery.
Output Functions
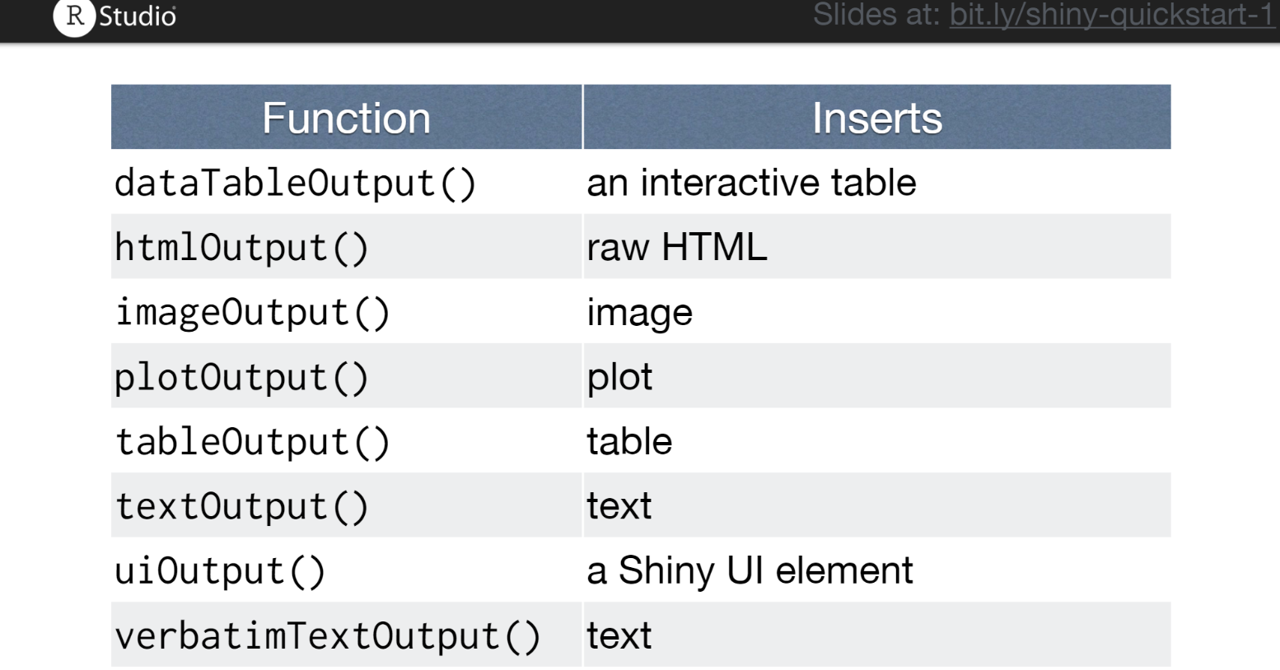
Output functions use what has been inputted and renders those inputs into helpful outputs.

Server
The server function manages what you can think of as the backend of the website. It will point to a list of objects that will be returned every time a user inputs a new value into one of the input objects (and on load). Those objects are then used in the user interface to display the result for the user.
The server function takes in an input and output parameter. You can reference the results of what the user has inputted by the syntax input$variable, where variable is the ID of the input object that you’ve created in the user interface. Generally, those ID’s are the first parameter in widget functions.
Inside of the server function, we create multiple output objects with the syntax output$first_plot, where first_plot refers to an ID inside an output function in the user interface. Again, the ID’s are generally the first parameters of these functions.
Render functions
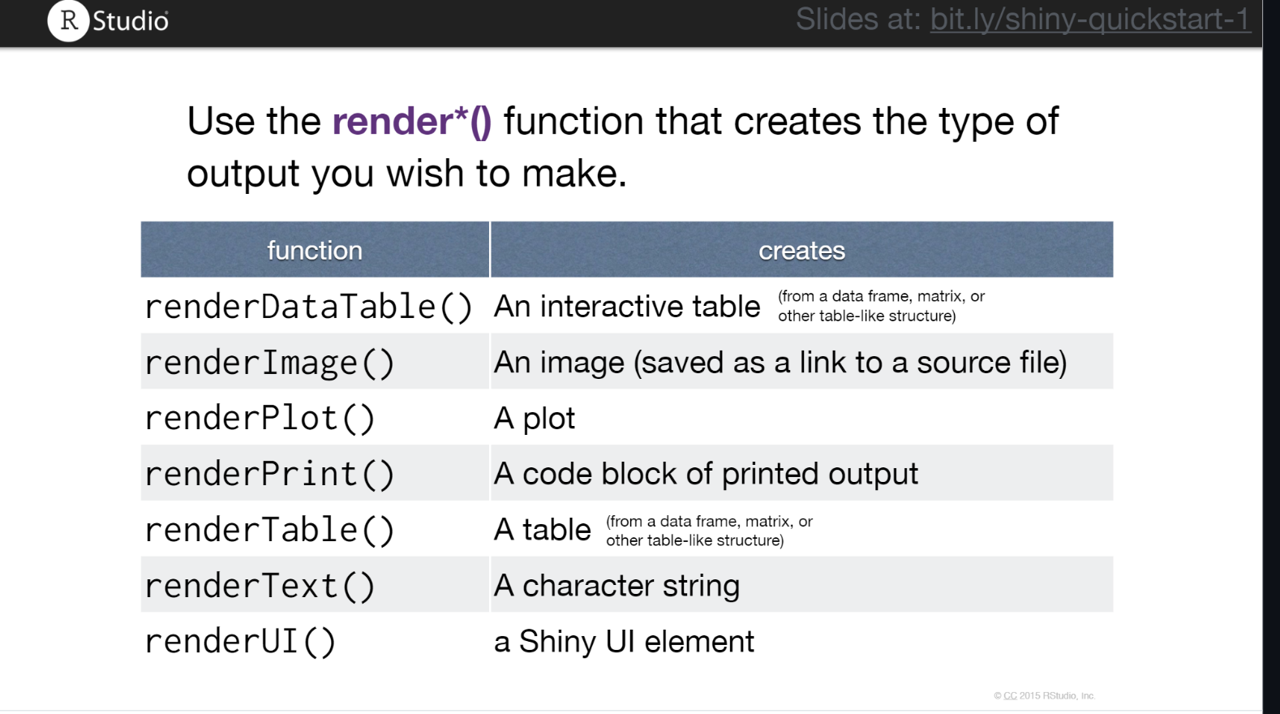
Each output object in the server function should have a render* function. These functions capture the reactive input from the user and create the relevant object.

Each render function takes in one argument surrounded by braces, from which you can include whatever code you need to output the type of object you want to output.
Examples
#
# This is a Shiny web application. You can run the application by clicking
# the "Run App" button above.
#
# Find out more about building applications with Shiny here:
#
#    http://shiny.rstudio.com/
#

#load libraries
library(shiny)
library(tidyverse)
library(urbnthemes)
set_urbn_defaults()

# set shiny options
options(shiny.sanitize.errors = TRUE)
options(scipen = 999)


#read in dataset with coefficients and standard errors
my_models <- read_csv("data/models.csv")

#pull unique model names to use later as choices user has to select from
unique_regs <- my_models %>%
  pull(var) %>%
  unique()

#user interface of app (what is shown on screen)
ui <- navbarPage("Example Regression App",
                 # make sure shiny.css is in www/
                 # if not, delete the following line
                 theme = "shiny.css",
                 #Create multiple tabs
                 tabPanel("Regression Plots",
                          #create sidebar/mainbar layout
                          sidebarLayout(
                            #create side panel
                             sidebarPanel(
                               #set width of panel (12 max)
                               width = 3,
                               #set style for sidebar panel
                               style = "background-color: #ffffff;",
                               #add row
                               fluidRow(
                                 #add column
                                 column(width = 5,
                                        #add urban logo
                                        tags$img(width = "250%",
                                                 height = "125%",
                                                 src = "images/urban-institute-logo.png"))),
                               #add empty lines
                               br(),
                               br(),
                               br(),
                                #create row
                                fluidRow(
                                #create dropdown radio buttons for regression
                                  checkboxGroupInput(inputId = "var",
                                                label = "Choose Dependent Variable",
                                                choices = unique_regs,
                                                selected = unique_regs),
                                    selectInput(inputId = "log",
                                                label = "Choose Whether to Log Outcome",
                                                choices = c("Unlogged" = FALSE, "Logged" = TRUE),
                                                selected = "Unlogged"),
                                         )
                                          ),
                             #create main area to plot
                            mainPanel(
                              #add empty rows
                              br(),
                              br(),
                              br(),
                              #add row
                              fluidRow(
                                width = 3,
                                #add plot
                                plotOutput(outputId = "main_plot")),
                              br(),
                              br(),
                              br(),
                              br()

                            ))),
                 #Add about page
                 tabPanel("About",
                          fluidRow(
                            column(width = 6,
                                   offset = 3,
                                   style = "padding-left: 3%",
                                   h4("This is an About page."))))

)


# create server session
server <- function(input, output) {

  #Render plot
  output$main_plot <- renderPlot({

    #filter dataset based on input from users
    my_dat <- my_models %>%
      filter(var %in% input$var,
             log == input$log) %>%
      #create lower and higher bounds for error bar and create a factor variable for significane
      mutate(se_low = est - ((1.96) * se ),
             se_high = est + ((1.96 * se)),
             is_sig_t = p_val <.05,
             is_sig = if_else(is_sig_t, "Significant", "Not Significant") %>% factor)

      #create a dataset that's long in order to easily graph error bar
      dat_long <- pivot_longer(my_dat, cols = c(se_low, se_high), values_to = "my_value")

      #create graph
      my_plot <- my_dat %>%
        ggplot() +
        geom_point(mapping = aes(x = var, y = est, color = is_sig)) +
        geom_line(data= dat_long, mapping = aes(x = var, y =my_value, color = is_sig), alpha = .5) +
        scale_color_manual(values = c("Significant" = palette_urbn_cyan[4], "Not Significant" = palette_urbn_magenta[5]), drop = FALSE) +
        geom_hline( yintercept = 0, linetype = "dashed", color = palette_urbn_yellow[5]) +
        scale_y_continuous(labels = scales::comma) +
        coord_flip() +
        labs(y = input$var,
             x = NULL) +
        theme(legend.text = element_text(size = 15, family = "Lato"),
              axis.text = element_text(size = 12, family = "Lato"),
              axis.title = element_text(size = 15, family = "Lato"))
    #return graph
    return(my_plot)
  }, height = 550, width = 850)


}

# build shiny application
shinyApp(ui = ui, server = server)