Rows: 1,500
Columns: 11
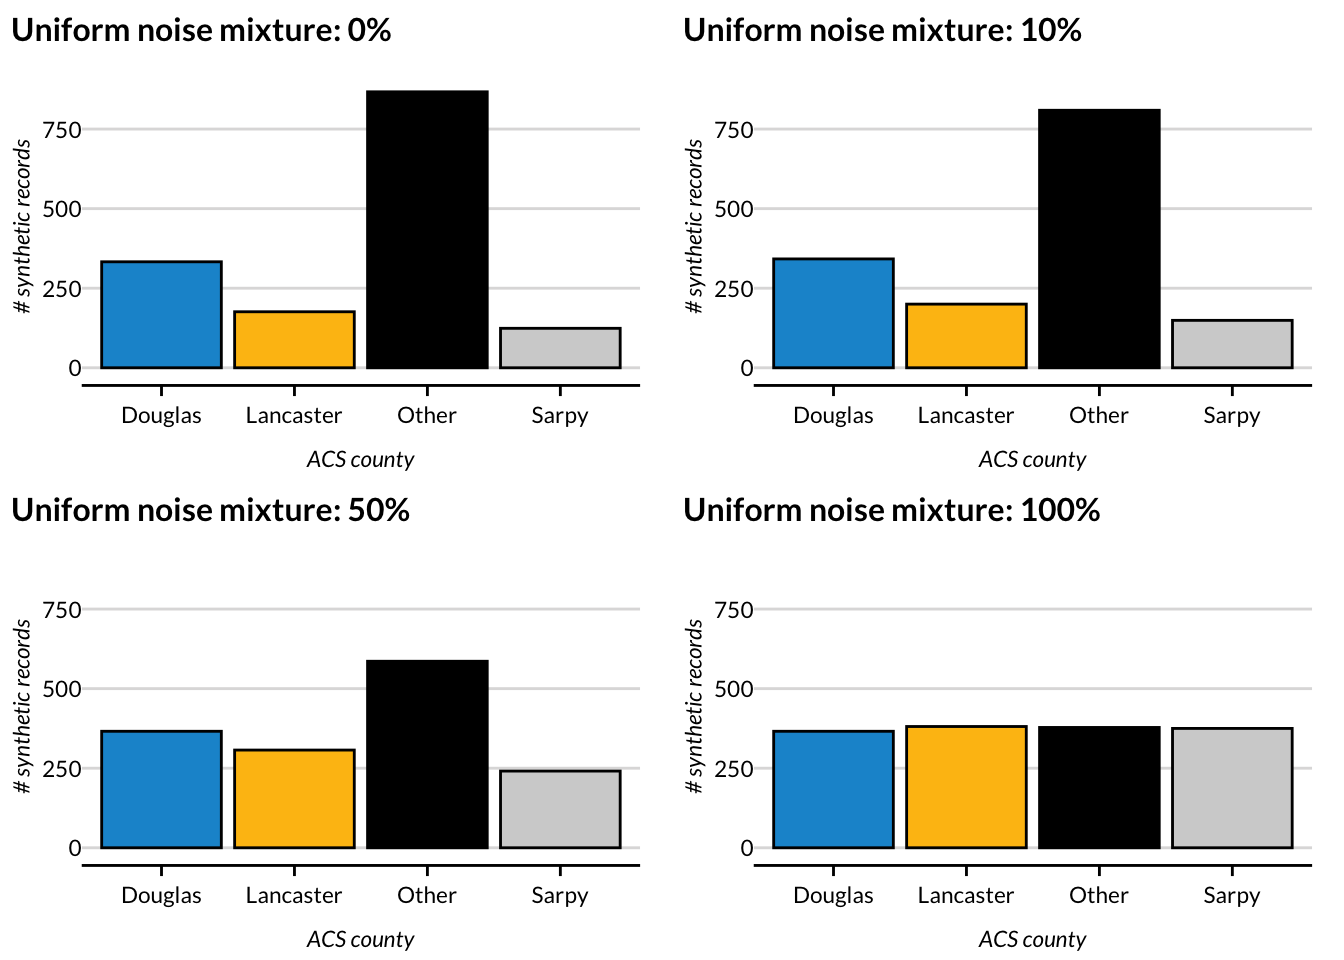
$ county <fct> Other, Other, Other, Other, Douglas, Lancaster, Other, Sa…
$ gq <fct> Household, Household, Household, Household, Household, Ho…
$ sex <fct> Female, Male, Male, Female, Male, Female, Male, Male, Mal…
$ marst <fct> Single, Married, Single, Single, Married, Divorced, Marri…
$ hcovany <fct> With health insurance coverage, With health insurance cov…
$ empstat <fct> NA, Employed, NA, NA, Employed, Employed, NA, NA, NA, Emp…
$ classwkr <fct> N/A, Works for wages, N/A, N/A, Self-employed, Works for …
$ age <dbl> 0, 41, 10, 12, 46, 36, 49, 5, 22, 31, 5, 55, 74, 50, 37, …
$ famsize <dbl> 5, 4, 3, 6, 5, 3, 5, 5, 4, 1, 4, 2, 2, 2, 4, 1, 1, 4, 5, …
$ transit_time <dbl> 0, 30, 0, 0, 15, 15, 0, 0, 0, 5, 0, 7, 0, 15, 10, 0, 0, 0…
$ inctot <dbl> NA, 68000, NA, NA, 91000, 26200, 6000, NA, 0, 37000, NA, …