FEMA Floodplains
get_fema_floodplain.RmdOverview
The get_fema_floodplain() function retrieves 100-year
and 500-year floodplain boundaries from FEMA’s National Flood Hazard
Layer (NFHL). The 100-year floodplain—formally, the Special Flood Hazard
Area—comprises areas with a one percent or greater annual chance of
flooding; the 500-year floodplain comprises areas with between a 0.2
percent and one percent annual chance of flooding.
Because the NFHL is a national dataset far too large to download in full, the function requires a bounding box (or an sf object from which a bounding box can be derived) and returns only the flood zone polygons that intersect it.
Note that the NFHL only covers communities with effective digital flood insurance rate maps; areas without digital maps return no polygons even though they may face flood risk.
Setup
library(climateapi)
library(tidyverse)
library(sf)
library(urbnthemes)

set_urbn_defaults(style = "map")
Retrieving floodplains
We illustrate with Lewis and Upshur counties in central West Virginia. We first obtain the county boundaries, then request all floodplain polygons intersecting their combined bounding box.
counties = tigris::counties(state = "54", cb = TRUE, year = 2023, progress_bar = FALSE) %>%
  filter(GEOID %in% c("54041", "54097")) %>%
  st_transform(5070)

floodplains1 = get_fema_floodplain(bbox = counties)
Polygons are returned wherever they intersect the bounding box, so we clip them to the two counties themselves.
floodplains2 = floodplains1 %>%
  st_transform(5070) %>%
  st_intersection(counties %>% select(county_name = NAME))

floodplains2 %>%
  st_drop_geometry() %>%
  count(county_name, floodplain, flood_zone)
#>   county_name floodplain flood_zone  n
#> 1       Lewis   100-year          A 48
#> 2       Lewis   100-year         AE 65
#> 3       Lewis   500-year          X 99
#> 4      Upshur   100-year          A 37
#> 5      Upshur   100-year         AE 26
#> 6      Upshur   500-year          X 18
Identifying structures in the floodplain
The get_structures() function returns building points
from the USA Structures dataset. With
keep_structures = TRUE, it returns the individual structure
records alongside the county-level summary.
structures1 = get_structures(
  boundaries = counties,
  geography = "county",
  keep_structures = TRUE)

structures2 = structures1$structures_raw %>%
  st_transform(5070) %>%
  filter(county_fips %in% c("54041", "54097"))
We classify each structure by the floodplain it falls in. A structure is counted in the 500-year floodplain only if it is outside the 100-year floodplain; because FEMA maps the 500-year zone as the increment beyond the 100-year zone, this classification treats the two categories as mutually exclusive.
floodplain_100 = floodplains2 %>% filter(floodplain == "100-year") %>% st_union()
floodplain_500 = floodplains2 %>% filter(floodplain == "500-year") %>% st_union()

structures3 = structures2 %>%
  mutate(
    in_100_year = st_intersects(., floodplain_100, sparse = FALSE)[, 1],
    in_500_year = st_intersects(., floodplain_500, sparse = FALSE)[, 1],
    floodplain = case_when(
      in_100_year ~ "100-year",
      in_500_year ~ "500-year",
      .default = "Outside floodplain"),
    structure_type = if_else(
      occupancy_class == "Residential", "Residential", "Non-residential"))
Mapping floodplains and residential structures
The map below shows the 100- and 500-year floodplains across the two counties, with points marking every residential structure located in either floodplain.
residential_in_floodplain = structures3 %>%
  filter(structure_type == "Residential", floodplain != "Outside floodplain")

ggplot() +
  geom_sf(data = counties, fill = "grey95", color = "grey40") +
  geom_sf(
    data = floodplains2,
    aes(fill = floodplain),
    color = NA) +
  geom_sf(
    data = residential_in_floodplain,
    size = 0.4,
    alpha = 0.3,
    color = "#db2b27") +
  geom_sf_text(
    data = counties,
    aes(label = NAME),
    size = 5,
    fontface = "bold",
    color = "black") +
  scale_fill_manual(
    values = c("100-year" = "#1696d2", "500-year" = "#a2d4ec"),
    name = "Floodplain") +
  labs(
    title = "Floodplains and residential structures") +
  theme_urbn_map()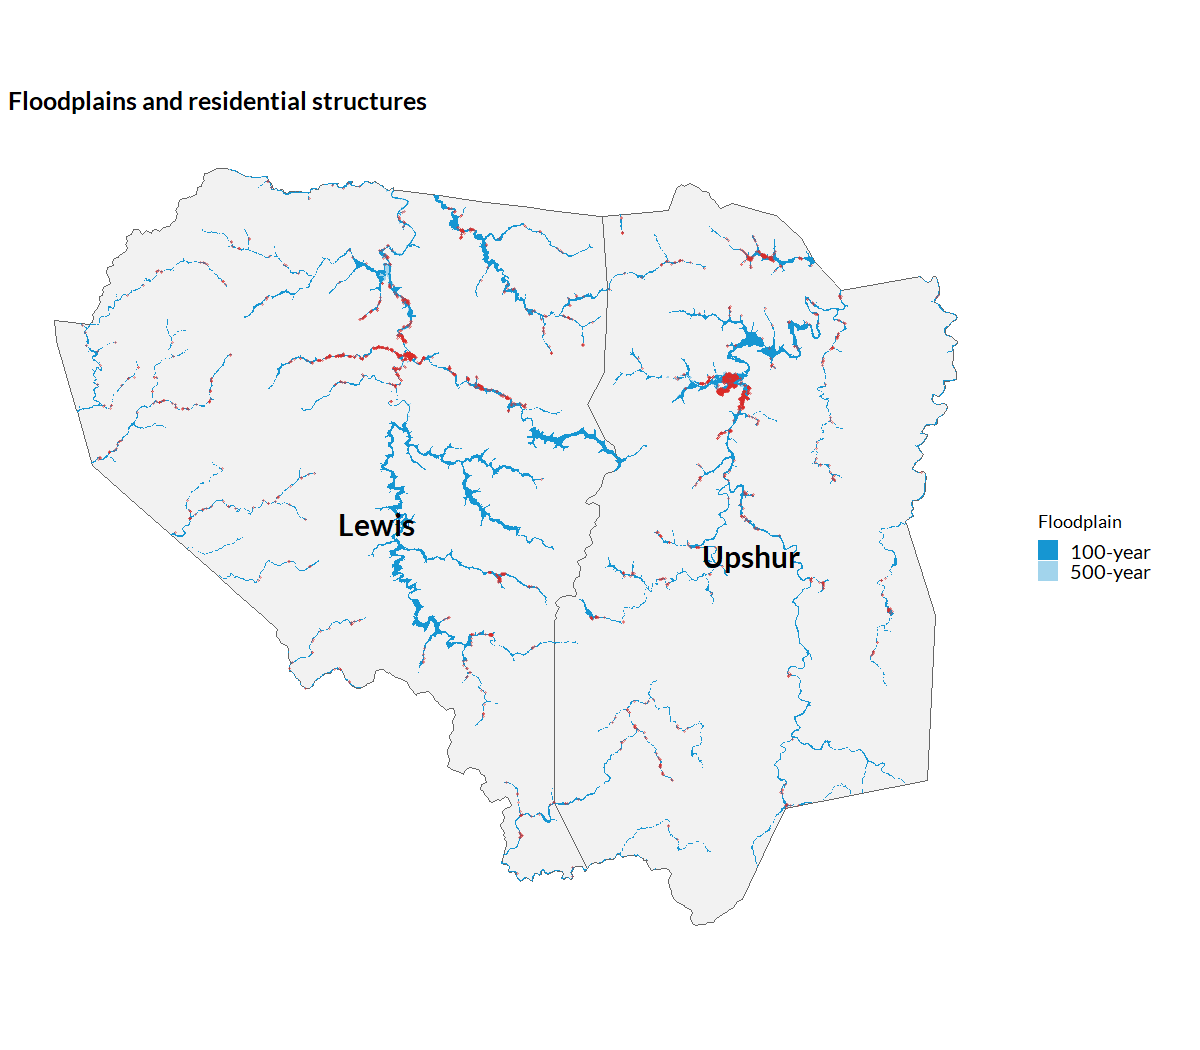
Structure counts by type and floodplain
Finally, we tabulate structures by structure type and floodplain category.
structures3 %>%
  st_drop_geometry() %>%
  count(structure_type, floodplain) %>%
  pivot_wider(names_from = floodplain, values_from = n, values_fill = 0) %>%
  select(
    `Structure type` = structure_type,
    `100-year floodplain` = `100-year`,
    `500-year floodplain` = `500-year`,
    `Outside floodplain` = `Outside floodplain`) %>%
  knitr::kable(
caption = "Structures by type and floodplain, Lewis and Upshur counties, WV")| Structure type | 100-year floodplain | 500-year floodplain | Outside floodplain |
|---|---|---|---|
| Non-residential | 630 | 122 | 3922 |
| Residential | 1908 | 384 | 22046 |